Azure Architecture
AMA, WAD, LAD, MMA, OMS, Telegraf or Log Analytics. Do you know which one or combination of which to use for what you need to achieve? If you do then congratulations and well done. Else, I hope this article can help you understand all these different agents so that you can make informed decision on what agent to use for what scenario and what they are compatible with.

AMA, WAD, LAD, MMA, OMS, Telegraf and Log Analytics agent are all names of Azure Monitor Agents so let us first revisit what Azure Monitor is. Azure Monitor collects monitoring telemetry from a variety of sources in Azure, other Clouds or on-premises. It aggregates and stores this telemetry in a log data store that is optimised for cost and performance. We can analyse data, set up alerts, get end-to-end views of applications, and use machine learning-driven insights to quickly identify and resolve problems. In this article, we will focus on the specific scenario where the source of Azure Monitor data is from Compute resources. Virtual machines and other compute resources require an agent to collect monitoring data required to measure the performance and availability of their guest operating system and workloads. Agents, and other log sources send data to Log Analytics Workspace in Azure Monitor which is the logical storage storage unit depicted by the grey box in the high level view of Azure Monitor visual above. At the time of writing, Azure Monitoring Agent (AMA) is still in Preview and has a few limitations. Depending on your requirements, you may need to still use the legacy agents or have AMA co-exist with the legacy agents.
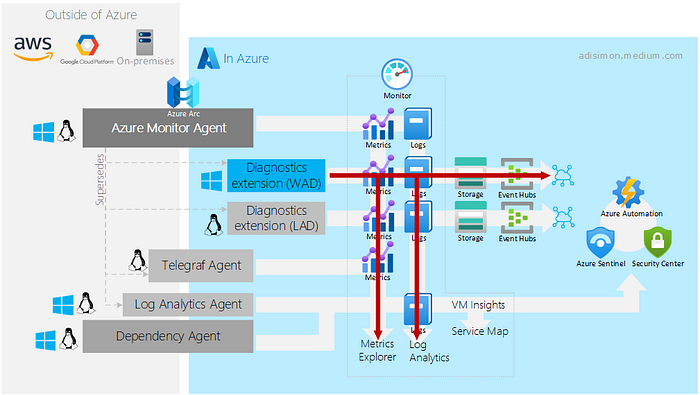
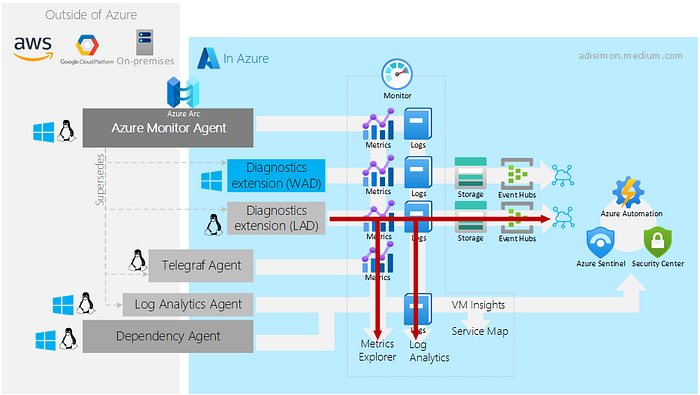
Below is a view of all the Azure monitor agents that you need to know. It illustrates a few things: the OS they can be installed on, whether or not they can be used outside of Azure, what type of data it collects, where the data can be sent to and various ways of making use of the data collected.

The Azure Monitor agents landscape is a little bit complex at the time of writing (as of August 2021). So before going into details I suggest we all remember one key thing: Azure Monitor Agent (AMA) will be your go-to agent in the future until Microsoft decides to replace it with something else. Azure Monitor Agent is going to replace Log Analytics Agent, Diagnostics Extension (WAD, LAD) and Telegraf agent, but for now Azure monitor Agent (AMA) has a few limitations and chances are you will need to have it coexist with other agents, in particular the Log Analytics Agent. Just be careful of data duplication should you choose to use multiple agents. These limitations are:
- Cannot use the Log Analytics solutions in production.
- No support yet for networking scenarios involving private links.
- No support yet collecting custom logs (files) or IIS log files.
- No support yet for Event Hubs and Storage accounts as destinations.
- No support for Hybrid Runbook workers.
If you can work with the limitations above for your scenario then simply use Azure Monitor Agent. Otherwise, chances are you will need to evaluate other agents based on a your requirements. One way of doing this is to use selection criteria like follows:
- Are you monitoring a Windows or Linux machine?
- Is your logs/metrics source in Azure or outside of Azure?
- How are you going to use the data collected?
The first criteria is very prescriptive. Agents are OS-specific so it goes without saying that one should choose the agents that are supported on the respective OS. This sounds overly trivial, nevertheless it is the first step that very quickly eliminate irrelevant agents. One thing you should also do at this point is to evaluate and note down what data are you after. These will come in handy when we evaluate the agents in the 3rd selection criteria later.
The second criteria is whether the workload that you want to monitor is in Azure or outside of Azure. At this point, do note that Diagnostics Extension (both WAD and LAD) are the agents that is Azure only. The others support workloads outside of Azure. Essentially those are agents that you need to install on the machines or virtual machines outside of Azure. These can be on other clouds such as AWS, GCP or even On-Premises, as long as the machines (or via a Log Analytics Gateway) can communicate back to Azure Monitor service over TCP port 443. The only exception to this is the Azure Monitor Agent. AMA is currently being implemented as Azure VM extension, so to use it outside of Azure, you have to use Azure Arc enabled servers.
The 3rd selection criteria is where things get interesting. As I briefly touched on above: different agents collects different data. In addition, different agent also send the data collected to different targets. At this point, I suggest you to use the visual I presented above to find where an agent can take you to. To do this, follow these 2 simple steps:
- Walk across to the right starting from your agent of choice, and walk all the way util the end of the path
- When you come across an intersection or crosswalk with an icon in it, go down until the end of the path
Let’s traverse each agent to get a good understanding of this. First is the Azure Monitor Agent (AMA).

AMA collects performance metrics and logs (event log on Windows and syslog on Linux) and send them across to Azure Monitor. It can send to multiple Log Analytics Workspaces, also known as multi-homing. Once the logs and metrics land in Azure Monitor, they can be viewed, queried and analysed using Log Analytics and Metrics Explorer.
Note that I have not drawn a path out from AMA to Azure Sentinel, Azure Security Center and VM Insights. This is because those are still in Private Preview. What this means is that while it is possible to achieve, be aware that features that are in Preview does not share the same level of SLA and support. I generally don’t encourage using features that are not yet in GA for production workloads.
The next pair of Agents we’ll traverse are the Azure Diagnostics Extension. There are 2 variants of this agent. We have Windows Diagnostics Extension (WAD) and Linux Diagnostics Extension (LAD). These can only be enabled only on VMs that reside within Azure.


Where they shine is their ability to send logs and metrics to Azure storage and enable streaming to Azure Event Hub. Having logs in Azure storage caters for scenarios where you have a need to retain logs say for auditing and archival purposes. The logs in Azure Monitor can only be retained to a maximum of 730 days, but with Azure Storage, it can be retained indefinitely.
Streaming logs to Azure Event Hub opens up powerful integration to other 3rd party monitoring and SIEM tools which are commonly used in many enterprises such as Splunk or ArcSight. See this list for full list of Azure Monitor partner integrations that are available. The Azure Diagnostics Extension is also able to collect a wide range of things. WAD can collect windows event logs, performance counters, IIS logs, application logs, .NET EventSource logs, manifest based ETW logs, crash dumps logs, file based logs and agent diagnostics logs. LAD can collect syslog, performance counters and file based logs.

The InfluxData Telegraf Agent is quite a specialised one. This is good if you have a need to collect and monitor workload-specific metrics on Linux VM and leverage them as custom metrics in Azure Monitor Metrics Explorer. Telegraf has over 150 input plug-ins that can be used. So although it is for metrics only, it is actually quite a powerful one.
Now if we backtrack a tiny bit to the point about the Azure Diagnostics Extension that are only for VMs in Azure. If the machines we want to monitor is outside of Azure, then we need to look at Log Analytics Agent. Personally, I find that to date, this is one of the most versatile agents, but it is very likely that my views will swiftly change when AMA eventually takes over. Log Analytics Agent is also known as the MMA (Microsoft Monitoring Agent) on Windows and OMS Agent on Linux. The Dependency agent also has the Log Analytics Agent as its prerequisite, so we’ll cover it in one go.

The Log Analytics Agent collects Windows event logs, performance counters, IIS logs and file based logs on Windows. On Linux, it collects syslog, syslog, performance counters and file based logs. It sends the data collected to Azure Monitor. Multi-homing is only supported for Windows. Log Analytics Agent is also a requirement for other services such as the Dependency Agent, Azure Security Center, Azure Sentinel and Azure Automation Change Tracking and Update Management feature.
There are two major drawback of Azure Log Analytics Agent:
- It cannot send data to Azure Monitor Metrics, Azure Storage or Azure Event Hubs.
- It is also very hard to manage because it needs to be configured at each VM.
These are the areas that Azure Monitoring Agent (AMA) aims to solve. With AMA, the data collection is managed on Azure monitor side using DCRs (Data Collection Rule) that you then associate to VMs.
If you use Log Analytics Agent and want to archive your logs into Azure Storage, then the way around this is to build another computation logic to export it out from Azure Monitor. This can be done using something like Logic App or Power Automate. See this article for more details.
I hope the information so far gives you an understanding of what each agents are, what their limitations are and the scenarios that they are applicable to. If I were to sum this up, it would be:
- Azure Monitor Agent (AMA) is your first go to if you can live with the limitations, else
- If your VMs are all in Azure, go with Azure Diagnostics Extension, else
- If your workloads are outside of Azure use the Log Analytics Agent
- If 2 or more agents co-exist, be aware of potential data duplicate in Azure Monitor
As always, this is only a baseline or starting point but I do hope it helps. Please read through the official Microsoft documentation and assess your use case in greater detail, especially this Microsoft Article.
